If anyone can find the Polenet Greenland GPS data please let me know cause I can't find it anywhere. There's no data on the Polenet site:
Their last blog post is missing.

The site they link to for the data, UNAVCO, has only two graphs for the entire island of Greenland, one from the periphery (KAGA) and one from the ridge toward the south of the ice cap (SUMM).

The site they link to for the data, UNAVCO, has only two graphs for the entire island of Greenland, one from the periphery (KAGA) and one from the ridge toward the south of the ice cap (SUMM).
http://www.unavco.org/data/gps-gnss/data-access-methods/dai2/app/dai2.html#grouping=Greenland POLENET - GNET;scope=Station;sampleRate=normal;groupingMod=contains
You might have to hit refresh on the page above to make the map load properly. Otherwise if that doesn't work: under Metadata choose Greenland POLENET - GNET in the network/campaign field and hit enter in that field.
You might have to hit refresh on the page above to make the map load properly. Otherwise if that doesn't work: under Metadata choose Greenland POLENET - GNET in the network/campaign field and hit enter in that field.

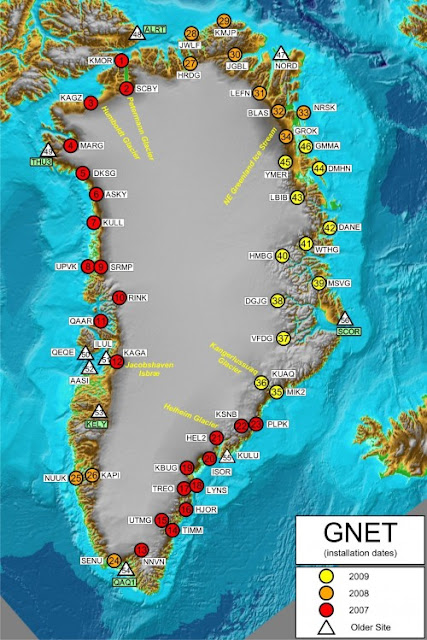
Only two graphs have data despite them having some 50 GNET sensors all reporting full functionality...seems odd. Here's a map of their installation dates mostly from the years 2007 to 2009. But there's very little data after 2011 that I can find.
The two graphs that are available are unusual. The one from the periphery, in the south west (KAGA), shows a remarkable slow down in crustal uplift over just a few years. This surely indicates a serious error either with the measuring equipment, or with my expectation and understanding of what earth's crust can do and I'm not an expert. Can earth's crust really change uplift rate that quickly within a matter of years?


The two graphs that are available are unusual. The one from the periphery, in the south west (KAGA), shows a remarkable slow down in crustal uplift over just a few years. This surely indicates a serious error either with the measuring equipment, or with my expectation and understanding of what earth's crust can do and I'm not an expert. Can earth's crust really change uplift rate that quickly within a matter of years?

Notice there's a slight acceleration from 2008 to 2013. This accelerating trend may have been used to justify the accelerating ice mass loss story of NASA GRACE during the same years.
The trend from 2013 to 2017 shows a reversal in the acceleration trend which gums-up the crustal uplift story of NASA. Is this the problem that the climate establishment are covering up? The distance east slows down too.
The GNET sensors were funded by a $1 million grant from NSF which would fund it to at least 2017, so they should still be running....yet no data.

The graph from the ridge inland is also strange. It shows that the centre of Greenland is sinking, which could mean that Greenland is gaining mass in snow which is pushing the centre of Greenland down. Although more likely there's some other error as a ridge sensor is not attached to the bedrock.

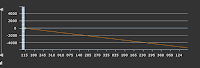
The Y-axis label is cut off in the above graphs. Here are those graphs again with Y-axis in meters and X-axis in months from beginning of graph (click to enlarge):


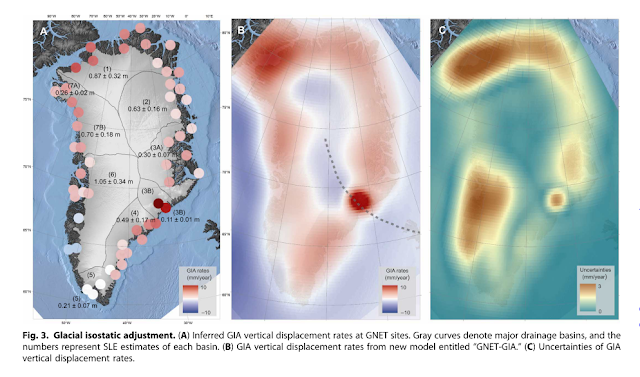
This paper Khan et al 2016 suggests that the centre of Greenland is sinking in the middle.


This paper Khan et al 2016 suggests that the centre of Greenland is sinking in the middle.

I suggest this is due to the centre of Greenland gaining mass as the NASA video below suggests. Most of Greenland's ice fell as snow during the last 10K years of the Holocene.
Earth has many negative feedbacks maintaining its climate in the goldilocks range conducive for life, such as clouds, dampening temperature fluctuations. But the positive-feedback bogey-man of earth's climate are the large ice sheets that can form on the northern continents.

Whatever warming impulse it is that ends the ice ages seems to disappear well before the interglacial period actually ends. Hence the end of the current interglacial is already likely beginning.
According to the ice cores earth has been cooling for 10K years or so.
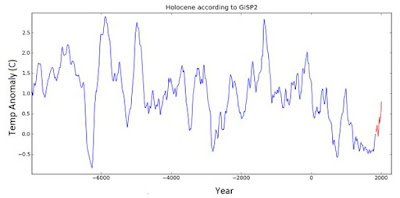
The last few interglacials have an initial high peak in temperature, and then a fairly rapid fall-off after that. Hence it is likely that the downward swing in temperature to the next ice age of this current interglacial is already starting.
Perhaps the trigger for the ice ages is simply that it snows a lot on northern continents until the ice sheets form and the albedo of the earth is increased. The cold positively feeds-back to cool earth for millenia. Maybe the warmth of the interglacial itself starts the process of increased snow until the effect of the accumulation of snow on land eventually overwhelms that which warms the earth to end the glaciation.
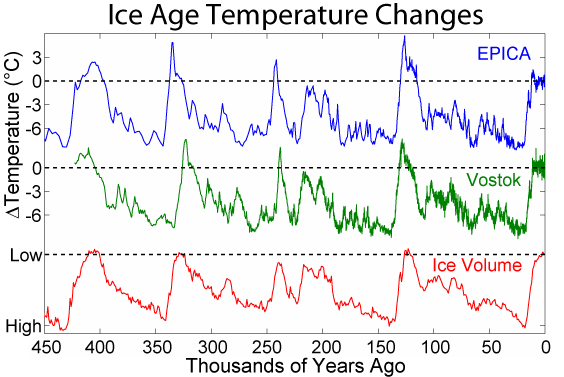
Overall in the last 3 million years earth has been cooling.

The Bevis et al 2012 paper (linked above) shows quite an uplift at Greenland's periphery in the GPS data:
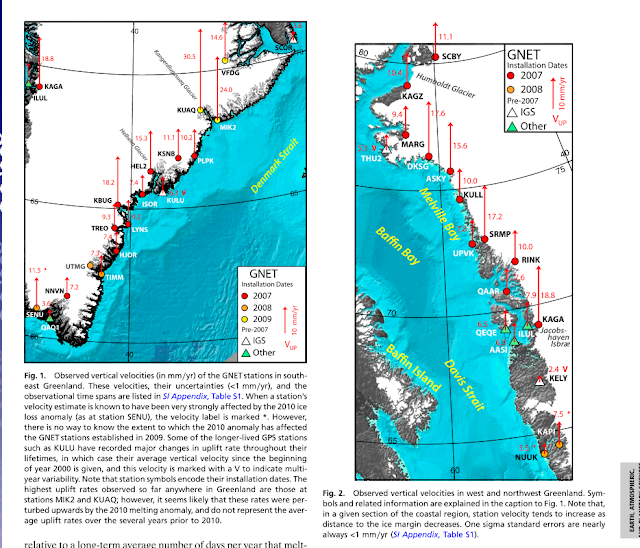
Yet the GIA applied by NASA suggests that the central and lower portions of Greenland are sinking, at odds with the GNET GPS data.
 |
| (source) |
This NASA study suggests that most of the current ice on Greenland fell as snow during the last 10,000 years.

There appears to be more snow accumulation in central Greenland the last 10,000 years as shown by the Alley graph below, which presumably depresses the middle and lifts the outside edge. Hence the outside edge of Greenland is not lifting due to ice loss from global warming, but due to the deformation of a rapidly forming new ice sheet in Greenland....and the start of the next ice age.
 |
| Greenland is sinking into earth's crust |
Warmist scientists are too distracted by the global warming issue to notice this potential looming climate crisis forming right under our nose -- the next ice age being the real potential climate crisis for earth.
This Richard Alley graph shows that Greenland gains mass with global warming:

Climate scientist Jason Box, who blocked me on twitter, says that Greenland gains 7% snow per degree of northern hemisphere warming.
Snowfall on Greenland increases 7% or 50 Gt per deg C N Hem warming (Box et al 2013). 2017 Greenland snow 100 Gt above ave. The math figures https://t.co/AmU2IZEnQ4— Jason Box (@climate_ice) July 3, 2017
As of January of 2018 things are looking pretty cold in Greenland and across the northern hemisphere. https://www.windy.com/?temp,74.937,-43.594,3,m:fMKaeZ0,p:off

=========================
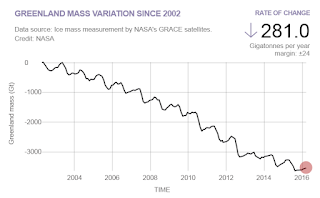
It's claimed that Greenland ice melt is contributing all this new water to earth oceans. If so why is there no acceleration of sea level rise to corroborate this?
 |
| I use NY tide gauge as a typical representative of sea level rise rate. Composite graphs are less trustworthy. |

Figs 3 & 4 from Bevin et al 2012.
In the graphs above an acceleration of crustal uplift from year 2000 to 2011 may have been useful for the narrative that the Greenland ice loss was accelerating. But the reversal of this trend at Kaga from 2013 to 2017 would have been a spanner in the works of the NASA GRACE Greenland ice mass estimate.
To begin with the whole idea of using satellite altimetry to measure the mass of Greenland is dubious at best. Really, using tiny differences in the distance between two satellites orbiting in space is better than say DMI's land-based mass estimate? I don't think so.
Notice that the GRACE satellite program has been quickly retired from service three months ago. A quick retreat from the whole debacle?
Update: Satellites measuring Earth’s melting ice sheets go dark

Will NASA ever admit to their Greenland ice mass loss fraud? A Zwally study showed the the GRACE mass loss for Antarctica was wrong, Antarctica was gaining mass:
https://www.nasa.gov/feature/goddard/nasa-study-mass-gains-of-antarctic-ice-sheet-greater-than-losses
========================
The Skeptical Science website assures its readers that the DMI land based estimate for Greenland mass which shows ice gain is wrong. They triumphantly use the NASA GRACE data as proof of how wrong DMI is.

Unfortunately for the spinmeisters at Skeptical Science it is the GRACE data which is highly in doubt. The Greenland-is-melting scare story relies on these highly peculiar and rapidly changing GNET GPS data. So we should trust GRACE over DMI? I think not.

No comments:
Post a Comment