Several climate metrics are claimed to be fingerprints showing that human fossil fuel combustion caused the recent atmospheric carbon dioxide rise [1, 2]. These are:
1) Rising CO2 and falling oxygen
2) Falling 13C/12C ratio
3) CO2 is highest in ~800,000 years

1)
A couple of things occurred simultaneously, both of which could cause the atmospheric CO2 increase and falling oxygen seen in the last few decades: fossil fuel combustion and deforestation.1)
O2 dropping faster than CO2 rising, due to deforestation, fertilizer use, etc?http://t.co/S8DCo9lyth #Climatechange pic.twitter.com/crt1LfH6Jc
— Ray (@tensiontest) 24 July 2015
In all the fingerprints listed on this page the effect of deforestation can't be separated from that of fossil fuel combustion; they both cause a rise in CO2, a decline in 13C/12CCO2 ratio, and a decline in oxygen.
If a fingerprint has more than one possible owner, it isn't really a fingerprint.
Environmentalists would argue that deforestation merely adds to the "urgency" of the CO2 situation and that all sources of increased CO2 are bad, especially if humans are the cause.
But if a substantial portion of the CO2 rise was from deforestation and not direct emissions, it dilutes the case for expensive (and ultimately futile) emissions reductions.
The IPCC 1990 first assessment report (FAR) estimated that 37% of the CO2 rise from the year 1850 to 1987 was due to deforestation.
That report estimated that by the time of the year 1987, the contribution of deforestation to the total for human emissions to be about 22%, with a range from 9.5% – 30.5%.
 |
| source |
Some warmists must have realised that the more CO2 that came from deforestation and not fossil fuel burning, the more harm the AGW-emissions-mitigation case there is. So predictably efforts are underway to minimize the level of CO2 rise said to be contributed by deforestation.
Chris Lang is one of those advocating for a downgrade of the 20% currently admitted to by the UN to 12% or less. He was so concerned he wrote a letter to the UN demanding they get their story straight.
Chris Lang was angry that as little as nine years ago the UN's FAO suggested as much as 30% of the CO2 rise was from deforestation/land-use-change.
To remove this embarrassing inconvenience, by the time of the most recent AR5 in 2013, the IPCC had concocted a huge land sink (see chart below) to cancel most of the atmospheric CO2-rising effect, by having the sink mostly cancel the source from deforestation.
Team Consensus and the IPCC decided that the Revelle factor overrides Henry's Law, such that the ocean can only absorb so much CO2. This means "something else" must be absorbing the extra CO2 if the ocean isn't. Hence the huge concocted land sink.
Henry's Law says basically that the more CO2 there is in the air, the more it absorbs in to sea water. But another factor called "Revelle" supposedly overrides that. More on this controversy here.
So the IPCC says if the ocean isn't taking up all the excess CO2 it must be a land sink which they call a "residual land sink".
It's a "residual" sink, where residual denotes the category where they dump all the unaccounted for CO2 in their carbon budget.
They don't have convincing evidence that the land is absorbing it, but because it's the only convenient scape goat they can find, they use it. And it has the handy side-effect that the impact of deforestation on the CO2 rise is minimised.
I think the ocean is absorbing all the excess CO2 that supposedly goes in to the residual land sink.
Perhaps warmists are attracted to the Revelle factor idea so as to cover up for why CO2 doesn't acidify the ocean as much as they claim.
In IPCC FAR that residual sink consumed 22% of total human emissions. In AR5 the sink was also considered to absorb about 21% of human emissions in the decade of 1980-1989.
But for some inexplicable reason the land sink almost doubles for the decades of the 1990s and 2000s; from 5.5 to 9.5 Gigatons Carbon (GtC), to absorb about 29% of total emissions (orange rectangle). This doesn't seem justified.
 |
| source |
It is true that new forest growth takes up more CO2 than old growth forest. And that CO2 is being taken up more by plants everywhere as the world greens due to the CO2 rise:
Global warming leads to a greener planet: more precipitation and fertilizing effect of CO₂ http://t.co/EPPcIuZE42 pic.twitter.com/Cw2m7BFRO3— Bjorn Lomborg (@BjornLomborg) February 27, 2015But it's not true that most of the forest that is removed is replaced by forest plantations and the like that take-up CO2 at a fast rate, that can justify the IPCC's enlarged land sink.
A good example is in Brazil where forest is being converted to pasture at a rapid rate. The enlarged land sink idea seems doubtful at best.
My belief is that even if humans stopped all CO2 emissions from combustion today, CO2 would continue to rise, being driven mainly by deforestation and temperature rise.
If 30% can be admitted to by the likes of the UN as being due to deforestation, I suggest an even higher proportion, like 60%, could be possible. It could even be much higher, like say 120% of human direct emissions (implying even more CO2 being sunk in to the ocean).
It just serves to highlight that natural fluxes of CO2 are so huge, and the accounting so uncertain, that we really have little idea just how much CO2 rise comes from man and how much from nature.
Both rising CO2 and falling oxygen levels can equally well be explained by deforestation. These are still both human-caused changes, but the case for these fingerprints being exclusive to fossil fuel burning is undermined.
2)
Deforestation can not only cause the same fossil fuel fingerprint in terms of rising CO2 & falling oxygen, but the falling 13C/12C ratio seen in the last few decades can also be explained by it.2)
Photosynthesis has a preference of the 12C isotope over the 13C isotope of carbon in carbon dioxide. This has the effect of elevating the 13C/12C ratio in the air by drawing down 12C.
When this process is disrupted by deforestation, less of the 12C isotope is sequestered and the 13C/12C ratio declines. Hence deforestation has the same effect to reduce the 13C/12C content of CO2 in the air as fossil fuel burning.
Dead plants that are burned as fossil fuels and living plants that are killed have much the same isotopic effect on the atmosphere.
Hence δ13C isn't a "fingerprint" that's exclusive to fossil fuel burning.
Tropical forest trees are C3 plants which have more of the 12C/13C preference effect than C4 plants. When old growth forest is turned to cropland all the carbon that is normally sequestered in to the ground is released to the air. And the conversion from C3 to C4 plants decreases the 13C/12C ratio.
Hence falling 13C/12C ratio is entirely consistent with deforestation. It's also consistent with the effect of an increase in temperature.
Perhaps this is because temperature increase affects oxidisation rates in the soil, or perhaps because of ocean outgassing; increases in air temperature itself appear to cause both increases in CO2 and 13C/12C decline.
This interesting graph compares southern hemisphere (where most of the oceans are) surface temperatures to rate of increase of CO2, and see how they match closely:

Also a paper by Jamal Munshi showing a closer correlation of increases in CO2 rise to temperature increases, shows that the temperature has this effect of increasing atmospheric CO2.
.@chaamjamal Between temp rise & deforestation..explains most of the CO2 rise. Very little rise from direct emissions pic.twitter.com/diEJfzhBsq— Paul Clark (@cbfool) August 13, 2015This graph is from Professor Salby [3, 4] showing much the same thing:
 |
| An index of surface conditions (blue: 80% temperature change, 20% soil-moisture content) is closely correlated with fluctuations in CO2 concentration (green). |
 |
| Left graph: CO2 increased in medieval warm period and it's all natural! Right graph: as CO2 increases δ13C declines. And it's all natural and happened before humans and their fossil fuel combustion. Source |
Hence not only can the CO2-rise/δ13C fall fingerprint be explained by deforestation, but also by mere temperature rises of the air as well. So that's now three possible owners of this "fingerprint".
From what I can gather, the δ13C of surface sea water is around -1.6‰, while in the air it is more like -7‰ [5, 6, 7].
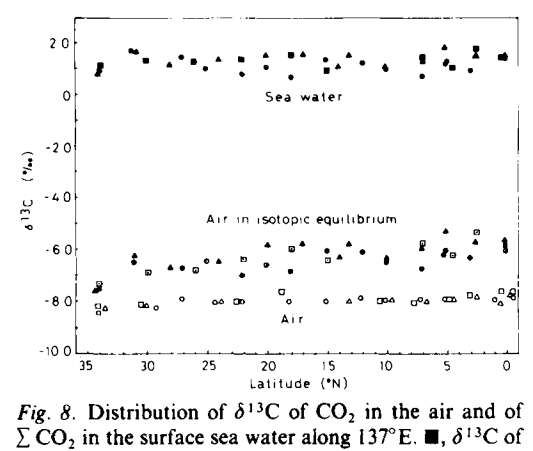
However a fractionation effect occurs when CO2 goes in to or exits sea water:

Although the isotope fractionation effect of a one-way trip is small – smaller than the δ13C of fossil fuels – the fact that there is a difference, and that the difference favours the absorption of 13C in the water, means to me that every time CO2 goes out of and back in to sea ocean it could loose a little more 13C to the sea water.
Hence, the atmosphere is enriched in 12C, causing the δ13C decline.
So while the outgoing sea-to-air isotope fraction is only ~10‰, which is less than that of fossil fuels, the fractionation effect of multiple cycles of CO2 ingress and egress to the sea water may have a cumulative effect.
Hence, even if rises in atmospheric CO2 are created by ocean outgassing there would still be at least some decline in δ13C.
If, as I speculate, this fractionation effect is cumulative, the falling 13C/12C fingerprint can now have four possible owners:
1) Fossil fuel combustion
2) Deforestation
3) Effect of temperature rises on land vegetation and soil
4) Effect of temperature rise leading to ocean outgassing.
No matter the source of CO2 rise, at least some decline in δ13C is caused.
Fossil fuels don't even have a set δ13C anyway, it varies from fossil fuel to fossil fuel and even within the same kind of fuel.

This is an unreliable fingerprint indeed.
And δ13C decline is failing to keep pace with rising fossil fuel combustion, indicating that there may be more CO2 with a bit more δ13C outgassing from the ocean. If the ocean is taking up surface heat as is often claimed, this would cause CO2 outgassing.
 |
| more here |
Pic link here
You could argue that the increased land sink is causing the 13C/12C slowdown. But then the oxygen decline would decrease, not increase as it has been [8].
The fact that the oxygen decline is happening faster than the CO2 increase indicates to me that the excess CO2 is being absorbed by the ocean, not by the IPCC fabricated residual land sink.
3)
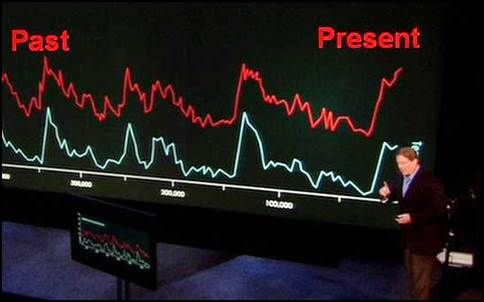
The claim is made that CO2 is the highest it's been in 400,000 years; 800,000 years; or you-name-it "X"-amount of years. Problem is we've only been measuring CO2 effectively for a few decades.3)
Proxies are a great way to see the past. But the way AGW-scientists do it isn't honest, splicing proxy data onto direct observations and pretending they're the same.
They do it with sea level rise. They do it with temperature. And they do it with carbon dioxide.
But of course, proxies are not comparable to direct measurements. There can be many problems with proxies in terms of calibration and how rapidly they can respond to fast changes in surface conditions.

Such a depiction as the graph above may work for low-info people who don't understand proxies or science in general. But considerable reservations about these proxies should be kept.
Chemical reactions and diffusion occur in ice both in the firn transition zone and after ice bubbles are sealed off [9, 10, 11]. The drilling process can be brutal and dirty [12].
And the rate of snow accumulation appears to be a major factor in the magnitude of past CO2 recorded.
In Antarctica where the snow accumulation rate is several times less than in Greenland, the level of carbon dioxide recorded is reduced.
 |
| source |
But the difference between poles recorded in ice cores more like 40ppm.
 |
| source |
So ice core proxies must be taken with a grain of salt.
AGW scientists prefer the lower Antarctic value of 280ppm for past CO2 because the lower value suits the AGW narrative they are payed to support.
But the Greenland GISP2 ice core perhaps suggests a Holocene average of more like 320 ppm – a value similar to what was measured near the beginning of the Keeling Curve in the 1960's.

But the amount in excess is small, maybe 70ppm, and it's entirely beneficial. There's no warming noticeable in any measure of the earth you care to take.
Earth is currently in CO2 deficit. Most life lived during times with CO2 being far higher.
Today's plants operate at subsistence levels of CO2 so low that photosynthesis is significantly impaired. At 180 ppm photosynthesis begins to shut down.
Earth and all planets of the solar system produce their own natural hydrocarbons. The very notion of "fossil" fuels is in doubt. Fossil fuels appear to be not from old decayed plants, but are abiotic in origin [14, 15, 16].
Earth has created "carbon" for billions of years and dumped it in to the biosphere. This life-giving CO2 is then sequestered by plants in the ocean and on land to keep it at the low level of the Holocene, say ~320ppm.
When natural CO2 sequestering systems are disrupted by deforestation and ocean pollution, the CO2 rises. I suggest this is the main cause of the CO2 rise rather than fossil fuel combustion.
================
All in all, I think CO2 is probably a bit above average for the last few thousand years by maybe a few 10's of ppm.
I think the oxygen decline narrows the cause of the CO2 rise to two main factors: fossil fuel burning and deforestation. But further distinction between these two main causes is impossible.
In the final analysis, the oceans control levels of atmospheric CO2, which is the real significance of Al Gore's famous graph.
Henry's law is not ultimately defeated by the Revelle factor, and I'm guessing Henry's Law would keep atmospheric CO2 from going above ~550 ppm – a level of CO2 that should be most welcome.
-------------
note: 13C/12C is same as δ13C in this post.
No comments:
Post a Comment