What causes the CO2 increase of 110 parts per million from the year 1850 to 2010? Is it human made or natural?

The Keeling Curve is perhaps the premier piece of global warming propaganda.

Its coincidence with the graph of human emissions over the same 50 year time period contributes to the impression that humans are causing the carbon dioxide increase.
Dave Keeling searched for years before finding the site with the desired properties at the summit of Mauna Loa in Hawaii.
CO2 is a heavy gas, preferring the ground to high altitudes. Strong daily circulation currents go up about 1 - 2 kms. The Mauna Loa site in Hawaii is chosen to be above this area of maximum CO2 activity. Elevation has a smoothing effect on the variations of CO2.

See also: Wisconsin Tower (below).
Keeling carefully selected his site at 3,400 metres to naturally smooth the curve making it appear coincidental to human CO2 emissions since 1850.


All of the measuring sites of the Scripps Institution of Oceanography are located close to the ocean.

This is for a reason: oceans readily dissolve carbon dioxide and so smooth the natural variations giving rise to the so-called background amount. The oceans control the amount of CO2 that's in air by an equilibrium of emission and absorption governed by the equation:
CO2(g) <==> CO2(aq)
The CO2 measured at Mauna Loa is technically true for that area (not withstanding artificial adjustments which I'll explain below), but to claim that it's representative of the whole Earth is global warming propaganda. There can be quite substantial variations in the lower troposphere that Mauna Loa never picks up.
CO2 doesn't mix well and can be chunky. It can take 50 years for CO2 from the northern hemisphere to reach the southern hemisphere. (See: Study of hemispheric CO2 timing...).
When you read the so-called global average given on the NOAA Earth System Research Laboratory website what you're getting is the average of marine surface sites. As I mentioned, due to the immense solubility of carbon dioxide in water the oceans smooth variations in the signal and this is the reason for the site selection. There could be all sorts of variation of CO2 on land and we wouldn't know based on this specially prepared analysis by Scripps, NOAA etc.
Historical measurements show much less smoothness and continuity as the specially smoothed Mauna Loa curve. You see the very flat linear shape at Mauna Loa in the middle of the Pacific (green line) compared to sites near the Atlantic and high continental mountains (red line):
There are around 38,000 billion tonnes of carbon in the ocean waters.

Judging by the area under the following graph total cumulative contribution of humans from the year 1850 to today is approximately 1.18 trillion tonnes CO2.

Using the above chart for carbon fluxes and stores and converting it to a CO2 equivalent there are 150.33 Tt CO2 in ocean, air and soils. This is the CO2 that's in regular flux in the biosphere.
1.18 Tt CO2 human ÷ 150.33 Tt CO2 nature = a 0.78% increase. Given the rapid solubility of CO2 in water a 0.78% increase can not lead to a 40% increase in the air.
With nature's huge sources and sinks is it not more reasonable to suggest that a small change in the natural equilibrium causes the CO2 increase?

Swedish climate expert Dr. Fred Goldberg estimates that humans contribute 4% to the carbon dioxide that's currently in air.
The current rise of CO2 from the year 1850 of 110ppm can be fully explained by supposing an increase of 1C in ocean temperature due to the reduced solubility of CO2 in warmer water.


And, a study by Jaworowski in Antarctica suggests that past CO2 variations were even greater than 100ppm and have been minimised by contamination of ice core samples and CO2 loss in the ice over time. (More references here)
The solubility of CO2 in the oceans is nowhere near saturation and has plenty of capability to absorb our CO2. Our cumulative emissions are small: less than 1% of the natural ocean store. Given the oceans massive reserve and high flux with the atmosphere, dissolved CO2 and carbonates in the ocean seems the most likely source of the CO2 increase.
When you read the so-called global average given on the NOAA Earth System Research Laboratory website what you're getting is the average of marine surface sites. As I mentioned, due to the immense solubility of carbon dioxide in water the oceans smooth variations in the signal and this is the reason for the site selection. There could be all sorts of variation of CO2 on land and we wouldn't know based on this specially prepared analysis by Scripps, NOAA etc.
On land the CO2 can vary by 100ppm in a day. E.g. compare Diekirch, Luxembourg to Mauna Loa:

It can change by ~100ppm in minutes depending on wind speed and direction.

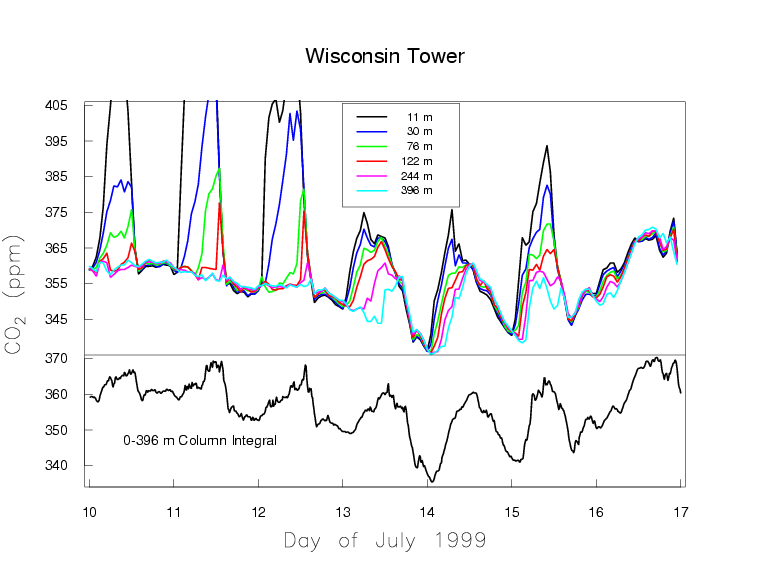
Over Wisconsin Tower CO2 can be very high in concentration in the morning in summer.
 So, while it's true to say that Mauna Loa measures a background level it ignores the fluctuations that can happen in the lower 2 kms of the troposphere and over land. Mauna Loa is good for trends but masks a lot of the true story close to the ground and over land.

It can change by ~100ppm in minutes depending on wind speed and direction.

Over Wisconsin Tower CO2 can be very high in concentration in the morning in summer.

Historical measurements show much less smoothness and continuity as the specially smoothed Mauna Loa curve. You see the very flat linear shape at Mauna Loa in the middle of the Pacific (green line) compared to sites near the Atlantic and high continental mountains (red line):

Furthermore, by using the Mauna Loa site adjustments can be made every time CO2 levels go out of bounds with the variations blamed on the nearby Mauna Loa volcano or wind. The Mauna Loa measurements and all contemporary carbon dioxide measurements made by Scripps and other authorities exclude variations of CO2 outside a certain bound. So, CO2 measurements appear much smoother than they really are. Again, nothing deceptive in and of itself, but if you pretend that this is the whole story for the whole world it is disingenuous because there is a conscious attempt to match the measured CO2 curve to human industrial output.
There are around 38,000 billion tonnes of carbon in the ocean waters.

Judging by the area under the following graph total cumulative contribution of humans from the year 1850 to today is approximately 1.18 trillion tonnes CO2.

Using the above chart for carbon fluxes and stores and converting it to a CO2 equivalent there are 150.33 Tt CO2 in ocean, air and soils. This is the CO2 that's in regular flux in the biosphere.
1.18 Tt CO2 human ÷ 150.33 Tt CO2 nature = a 0.78% increase. Given the rapid solubility of CO2 in water a 0.78% increase can not lead to a 40% increase in the air.
With nature's huge sources and sinks is it not more reasonable to suggest that a small change in the natural equilibrium causes the CO2 increase?

Swedish climate expert Dr. Fred Goldberg estimates that humans contribute 4% to the carbon dioxide that's currently in air.
The current rise of CO2 from the year 1850 of 110ppm can be fully explained by supposing an increase of 1C in ocean temperature due to the reduced solubility of CO2 in warmer water.

Real Climate wants us to believe that nature causes the large seasonal variation in CO2 but has nothing to do with the yearly increase. If Real Climate was right and dC13 is a human signature then the graph of the dC13 would look like a fairly straight line like human emissions. Instead, it takes the shape of the natural seasonal variations.

Past CO2 concentrations varied by 100ppm by itself without human intervention. It appears ocean heat releases the CO2 with a time delay of about 800 years.

And, a study by Jaworowski in Antarctica suggests that past CO2 variations were even greater than 100ppm and have been minimised by contamination of ice core samples and CO2 loss in the ice over time. (More references here)
The solubility of CO2 in the oceans is nowhere near saturation and has plenty of capability to absorb our CO2. Our cumulative emissions are small: less than 1% of the natural ocean store. Given the oceans massive reserve and high flux with the atmosphere, dissolved CO2 and carbonates in the ocean seems the most likely source of the CO2 increase.
sw00t
ReplyDeleteUr an idiot, as well as a jerk for slandering a professional scientist like Keeling. He searched for a site to make this all coincidental? Jeebus on a cracker, do you have any idea how ignorant that sounds? Your preconceived notions and assumptions keep you deep in the stupid...
ReplyDeleteI admit I wrote that post in anger, and my term "global warming propaganda" was an unfortunate choice on my part. I would have written that differently if I had to do over. Mauna Loa does show trends well but obscures a lot of the story, and is therefore more convenient for the global warming narrative.
ReplyDeleteI don't think Keeling was willfully deceptive, but the Mauna Loa data sure was convenient to make CO2 seem so constant and obscure the great natural variation that can be measured elsewhere.
It's interesting that his son talks of closing the Mauna Loa measuring site down. If CO2 trends down e.g. with cooling oceans, the AGW movement could be over.
http://www.nature.com/news/budget-crunch-hits-keeling-s-curves-1.14206